Items 13–23 02
Item 19
Which brands publish unit-level results, which publish one store, and which publish nothing at all. A financial performance representation is optional.
Item 19 is where a franchisor may show actual or potential outlet numbers — sales, costs, profit. The FTC rule requires a reasonable basis, written substantiation and specified context. A franchisor may instead state that it makes none.
That yes-or-no is only the start. Two brands can both have an Item 19 and disclose fundamentally different evidence.
Five common shapes
No representation. The Item contains the prescribed notice rather than sales or earnings data. That is lawful. It means you must not treat an informal revenue, income or payback claim from the sales process as a substitute. The FTC’s buyer guidance is blunt: financial claims made by a seller should appear in Item 19, subject to narrow exceptions.
A limited outlet example. A young system may have only one mature franchised outlet or a handful of company stores with enough history. The result can be accurate but not representative of a new market, a different format or an owner-operated unit. Record the denominator before recording the revenue.
An average or median. An average can be pulled upward by a few large stores. A median describes the middle observation but says nothing about the width of the range. Look for the number and percentage of outlets that met or exceeded each statistic.
Subsets or quartiles. A table may divide outlets by geography, format, age or performance band. That can add useful detail, but only if the selection rule and excluded population are clear. Do not apply the top quartile to an ordinary projection.
Company-store data. Affiliate outlets may have different leases, management depth, purchasing arrangements or maturity from franchised stores. Company results are evidence about those stores, not automatic evidence about a franchisee’s costs.
A worked comparison
Whether Item 19 exists tells you less than what it contains. The Great Greek Mediterranean Grill’s 2023 filing reports revenue, food-cost and payroll for affiliate restaurants and selected franchise restaurants. Mad for Chicken’s FDD issued 12 March 2025 reports revenue for affiliate and franchised outlets but not a complete profit measure. The 2024 filings used for Shah’s Halal and The Halal Guys make no financial performance representation. Those are different kinds of evidence.
GDK’s 2025 FDD, The Halal Guys’ 2025 FDD and the 2025 Shah’s Halal filing are the current public packets. For each one, the only Item 19 notes that matter are metric, period, which shops, who was left out, and whether expenses are in the table.
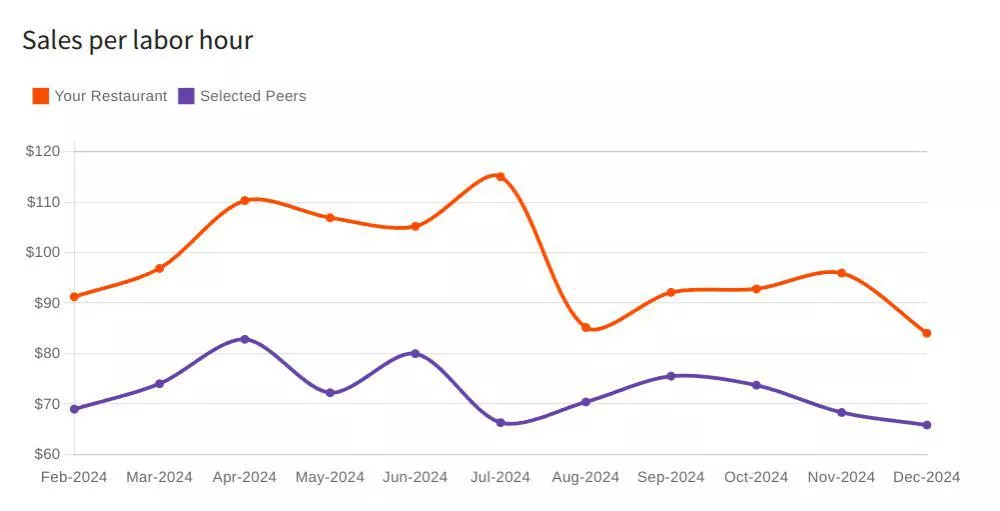
Item 19 is the filing’s performance representation. A marketing chart is a separate exhibit: useful as the company’s view of labour productivity. It does not replace the Item.
From the table to a model
Start with the represented population, not the best result. Match your intended format, market, opening age and ownership model as closely as the data allows. Revenue is not profit; subtract independently researched occupancy, labor, food, delivery, insurance, debt service and the Item 6 obligations. If an Item shows selected costs, confirm which costs are omitted and whether the accounting treatment matches your model.
Then use Item 20’s contact lists. Ask operators how long ramp-up took, what changed after the represented period and whether their format resembles yours. Do not ask them to bless a single sales target; ask for the conditions that produced a range of outcomes.
What the filings actually say
| Brand | Item 19? | What the record actually says | Source |
|---|---|---|---|
| GDK | Yes | One franchised outlet at American Dream Mall, East Rutherford, the only unit open for the full year. 2023 gross $1,383,053 | FDD issued 3 September 2024 |
| The Great Greek Mediterranean Grill | Yes | Gross revenues, COGS and payroll for six affiliate restaurants, plus high and low of six franchise restaurants open two years | FDD issued 17 August 2023 |
| Mad for Chicken | Yes | Unaudited 2023 and 2024 gross revenue for affiliate and franchised outlets, revenue only. Six outlets that closed during 2024 are excluded | FDD issued 12 March 2025 |
| 375° Chicken ‘n Fries | Yes | Unaudited affiliate income statement, 2020–2023. 2023 sales $3,782,437 across two corporate shops | FDD issued 30 April 2024 |
| Döner Haus | Yes | Corporate and early franchised units | 2026 Franchise Disclosure Document |
| Dog Haus, Capriotti’s, Pepper Lunch, Wienerschnitzel | Yes | A representation is made; read the cited source for metric and sample | May 2024 comparative study of published FDDs |
| Shah’s Halal Food | No | The filing states that no financial performance representation is made | FDD issued 10 April 2024 |
| The Halal Guys, Crave Hot Dogs and BBQ, bluTaco | No | No representation is made | May 2024 comparative study of published FDDs |
A “yes” is a fact about a document rather than about a brand, and it can be withdrawn. GDK’s representation appears in the filings issued 20 July 2023 and 3 September 2024, and the filing registered in Wisconsin on 24 September 2025 makes none at all: its Item 19 carries the standard explanatory paragraph and a leftover sentence referring to a “preceding financial performance representation” that is not in the Item. Reading successive filings works that sequence through.
Döner Haus’s 2026 FDD discloses figures for corporate and early franchised units. GDK’s Item 19 is one mall unit. Mad for Chicken’s is revenue without costs. 375°’s is two corporate shops. Great Greek’s is the rare cost-inclusive sample here, and it is still partly affiliate. Read each Item in the filing for the metric and the sample.
Shah’s “no” is lawful. It means the FTC walkthrough’s advice applies with extra force: if a seller quotes sales anyway, ask for the Item 19 page. There is not one.
Subset traps, worked
Full-year filter. GDK’s 2024 table required a full year of operations. Shops that opened mid-year were out. A new suburban inline is a different format and trade area from the mall unit that remains.
Affiliate costs. Great Greek shows COGS and payroll for affiliates. Franchisees pay royalties (6%), brand fund (3%, raisable to 4%), and 1% local — FDD issued 17 August 2023 — which affiliates may not bear in the same way. Subtract the Item 6 stack before treating affiliate payroll as yours.
Revenue-only. Mad for Chicken’s franchised outlets in the 12 March 2025 sample cannot support a profit claim, and the table leaves out four affiliate and two franchised outlets that closed during 2024 after operating between two and eleven months. Ask the operators who remain about occupancy and labor; do not invent a margin, and do not read a table of survivors as a table of all attempts.
Corporate income statement. 375°’s $3,782,437 is two corporate shops in 2023, unaudited. Treat it as affiliate results, not as a franchisee pro forma. Item 20 that year: 5 total, 2 franchised.
International mix-in. Pepper Lunch’s 2024 comparative record discloses 6 US units and an Item 19 in that US filing. An operator website claiming 500+ locations across fifteen countries is not the sample.
Before a number enters the model
- Metric, period, outlet type, eligible vs included vs excluded.
- Whether expenses are shown, and which expenses are omitted.
- Whether the shop you would build matches format, age and channel.
- Item 20 contact list used to test ramp-up, not to bless a single target.
- Empty Item 19 left empty.
What a “yes” still forces you to build
Great Greek’s 2023 filing gives COGS and payroll for affiliates. You still have occupancy for your lease, delivery commissions for your mix, the 6% / 3% / 1% stack, a $2,500 renewal fee decades out, and a transfer fee that can be 10% of sale price. The Item does not contain those as a single “net to owner” line. Do not invent one.
GDK’s $1,383,053 is gross at one mall in 2023. American Dream Mall is a different trade area from a suburban inline. Do not treat that gross, unadjusted, as yours. If you use the figure at all, ask what would have to be true locally to approach that volume, and which of those conditions Item 20 and the lease actually support.
375°’s $3,782,437 across two corporate shops in 2023 is an affiliate income statement, unaudited, covering 2020–2023. Corporate occupancy, labor mix and lack of royalty are the first three adjustments an accountant should refuse to skip. Two shops are a small sample.
If the May 2024 comparative study only records that Dog Haus, Capriotti’s, Pepper Lunch or Wienerschnitzel “make a representation,” stop at that fact here and open the filing for the metric. Do not recall a number from a broker one-pager.
Related reading
- Reading successive filings — the measurement window rolls, and the year that drops out
- Item 20 outlet tables — whether the sample could even exist
- Validation calls — how to ask without turning a call into a fake FPR
- Red flags in franchise marketing — charts that are not Item 19
- Attorney and accountant — who builds the model from a subset
- Comparison worksheet — population fields, not the highlight figure
| Brand | Item 19 | System units | What the record says | Source year |
|---|---|---|---|---|
| 375° Chicken 'n Fries | Yes | 5 | An unaudited income statement for the affiliate that operates the restaurants, covering 2020 to 2023. 2023 sales $3,782,437 across two corporate shops. | 2024 |
| Atomic Wings | No | 20 | No financial performance representation in either the 2024 or the 2025 filing. | 2025 |
| bluTaco | No | 34 | No representation is made. | 2024 |
| Capriotti's | Yes | 145 | A representation is made; read the cited source for scope. | 2024 |
| Crave Hot Dogs and BBQ | No | 26 | No representation is made. | 2024 |
| Dog Haus | Yes | 58 | A representation is made; read the cited source for scope. | 2024 |
| Doner Shack | No | 0 | No representation is made. | 2025 |
| Döner Haus | Yes | 6 open | Covers corporate stores and early franchised units — shops the company still operates. | 2026 |
| German Doner Kebab | Yes | 5 open | One franchised outlet at American Dream Mall, East Rutherford, the only unit open for the full year. 2023 gross revenues $1,383,053. The 2018 and 2021 filings made no representation at all; the 2023 filing introduced one and it has covered the same single outlet ever since. | 2024 |
| Mad for Chicken | Yes | 12 | Unaudited 2023 and 2024 gross revenue, affiliate and franchised outlets, revenue only with no costs or profit. The table excludes six outlets that closed during 2024. | 2025 |
| Pepper Lunch | Yes | 6 | A representation is made; read the cited source for scope. | 2024 |
| Shah's Halal Food | No | 58 | The filing states that no financial performance representation is made. | 2024 |
| The Great Greek Mediterranean Grill | Yes | 31 | Gross revenues, cost of goods and payroll for six affiliate restaurants, plus the highest and lowest of six franchise restaurants open two years. | 2023 |
| The Halal Guys | No | 93 | No representation is made. | 2024 |
| Wienerschnitzel | Yes | 323 | A representation is made; read the cited source for scope. | 2024 |